
AI Agent Observability and Monitoring: The Enterprise Stack
A standard infrastructure monitoring stack can confirm that an AI agent's purchase-order request completed successfully. Without agent-specific telemetry, it reveals nothing about whether the agent approved the correct order. That single fact shows why the monitoring stack you built for microservices doesn't cover agents.
It also explains why 40% of enterprises will demote or decommission autonomous AI agents by 2027 because governance failures surface only after production incidents occur, according to Gartner's 2026 forecast. The incident comes first, while the governance follows.
If you own the AI program, you need logs that satisfy regulators: what the agent decided, why, and what it cost. Most production agent deployments don't have that instrumentation yet. When an incident happens, teams end up reconstructing the decision path by hand.
What AI Agent Observability Covers That APM Cannot
Traditional application performance monitoring (APM) typically focuses on deterministic code, where the same input follows an expected path. Failures surface as exceptions, latency spikes, or error codes. An AI agent interprets a goal and decides how to reach it. The same input can therefore produce a different sequence of model calls and tool invocations, with retrievals also varying on every run.
Agent failures may not throw exceptions. An agent can retry unnecessarily or invoke an unsuitable integration. It can also return an unsupported policy interpretation while the request still reports success as no error appears.
With complete instrumentation, AI agent observability records every step of that decision path as one connected trace. It captures the prompt each model saw, the available tools and the tool chosen, the arguments passed, and the documents retrieved. It also records how many times the agent looped and which sub-agent received a handoff. Quality signals on the same trace indicate whether the output was correct and whether the request completed. Each step stays visible.
Large language model (LLM) observability covers a narrower unit: one model call. It records the prompt, completion, tokens, and latency. Agent observability records the full run behind one request. That run may include numerous model calls, tool invocations, vector lookups, and handoffs between agents. A vector lookup searches stored content for items with similar meaning.
Any of these operations can fail without an error. One agent workflow creates many LLM spans. A span is the recorded operation for one step within a trace. The trace is the unit of analysis.
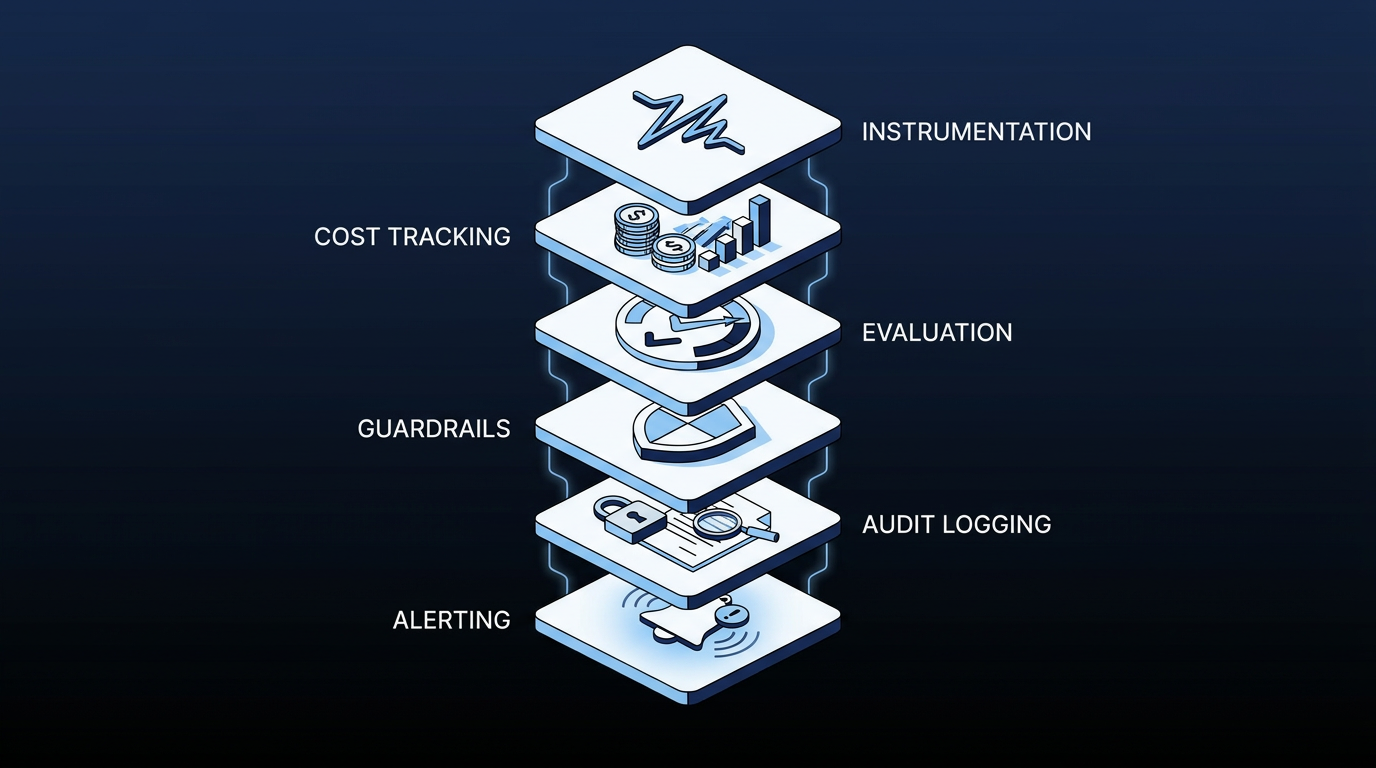
Build the Six Layers of an Enterprise AI Agent Observability Stack
In many organizations, tracing, cost control, security policy, and audit retention have different owners. Teams therefore commonly manage these functions in separate products across platform, security, FinOps, and compliance groups. Skipping a layer doesn't produce an error at deployment. It produces a question you can't answer during an incident.
Instrumentation and Distributed Tracing
OpenTelemetry GenAI semantic conventions provide a shared contract. These conventions are standard names and formats for recorded telemetry. They define invoke_agent as one span type, alongside chat and execute_tool. Attributes include gen_ai.request.model; token usage appears in gen_ai.usage.input_tokens and gen_ai.usage.output_tokens.
A sub-agent nests as another invoke_agent span, so a multi-agent handoff adds depth to the existing span tree. The data type remains the same. In many organizations, platform and site reliability engineering (SRE) teams own this layer.
Metrics, Cost, and Token Tracking
This layer records cost per run, tokens per span, session counts, and error rates. It attributes them to a specific agent and team, down to the workflow. FinOps, the practice of managing cloud and AI spending, commonly enforces budgets. The platform team typically manages the underlying systems.
Evaluation and Quality Scoring
Automated evaluators, often a second model acting as judge, score task completion, tool selection, grounding, and safety on sampled production traffic. Grounding checks whether an answer has support from approved evidence. This layer evaluates output quality and execution status separately.
Guardrails and Policy Enforcement
Rules block an action before it executes. A gateway outside the agent's own code evaluates them so the agent can't reason around them. The gateway decides. In a common operating model, security and compliance author the policies, while the platform team enforces them.
Audit Logging, Lineage, and Identity
This layer creates immutable records of the trigger and every tool call with its arguments and responses. The records also cover the data accessed and under whose permissions. They identify which guardrails fired and who approved what and when. The records include the active model version as well. Lineage is the record of where data and outputs came from. Compliance commonly owns the requirements, while security owns agent identity.
Alerting and Incident Response
Alarms cover latency and error rate. They also flag abnormal token consumption. This layer turns a bad production trace into a regression test. The test reruns the failed trace. SRE commonly owns routing, while AI engineering owns root cause.
Observability platforms package these functions differently. Some offer evaluation separately from observability, while others group evaluation, monitoring, tracing, and runtime guardrails under one umbrella. Compare products against these six layers rather than their category labels.
Detect the Failure Modes Infrastructure Monitoring Misses
Teams should design useful telemetry backward from the ways agents break in production. The expensive breaks don't look like outages.
Runaway loops can silently escalate costs because an agent that cannot resolve an input may repeat steps and continue spending tokens instead of terminating. Infrastructure-only dashboards may not reveal token-driven cost escalation. Per-node token tracking exposes the accumulating cost, while an alert that fires after the spend isn't a control. Costs keep climbing. Inference costs per agentic workflow will increase more than fivefold through 2028, according to Gartner's inference forecast. That turns last year's nuisance loop into a budget event.
Cascading hallucinations across agents begin when an incorrect retrieval or model output becomes the input to later agents. One bad step can then distort the rest of the run. These cascading agent failures may still produce downstream responses that look internally consistent. Validation only at the final output can therefore accept a polished but unsupported result. Catching these failures requires grounding checks at agent boundaries and passing the same trace identifier across parent and child agents during the handoff.
Tool results can carry prompt injection, the top-ranked risk in the Open Worldwide Application Security Project's (OWASP) ranking for large language model applications. In agentic systems, malicious instructions in untrusted content can hijack an agent's behavior. Instructions hidden in an email or a ticket description can arrive as a tool result and redirect the agent.
The same applies to instructions in a product listing. Tool results can attack. The telemetry that catches this attack inspects tool output before it enters context. It also watches email sends and HTTP posts as outbound tool calls on the exfiltration path, the route an attacker could use to remove data. File writes receive the same scrutiny.
Hallucinated tool arguments arise when an agent asserts an invented record ID as fact. It can also report a task complete when the system state says otherwise. Schema validation, which checks tool arguments against the required format before execution, and outcome verification against actual system state are the controls. Infrastructure-focused APM may not provide these agent-specific controls.
An audit that does not hold makes decisions unauditable. Article 12 of the EU AI Act requires high-risk systems to support automatic recording of events (logs) over the lifetime of the system, and Article 26(6) obligates deployers to retain those logs for at least six months, even when the system came from an outside vendor.
A 2026 EU regulation pushed the compliance date for these Annex III high-risk obligations from August 2026 to December 2, 2027, but the requirement itself didn't change: teams still need automatic, system-generated recording, and the later date is runway to build it properly rather than a reason to set it aside. If teams cannot reconstruct a decision trace from system-generated logs, they cannot defend that decision in an audit or compliance review.
Why Observability Is Not Governance
Observability tells you what an agent did. Governance decides what it's allowed to do before side effects land, and enforcing that decision takes more than a dashboard. Autonomous agents need rapid rollback mechanisms, enforced guardrails, and circuit breakers that halt agent operation on threshold violations, alongside continuous monitoring. Analyst Shiva Varma names the root cause: "Enterprises are treating AI agent governance as binary, either locked down or fully trusted, and that is the root cause of failure."
Two architectural answers have emerged, and they aren't substitutes. The first is the AI agent control plane, a third functional plane alongside where agents are built and where they run. This layer discovers, identifies, authorizes, and observes agents regardless of origin. Control planes watch and govern. They do not execute your business logic.
The second is a deterministic process engine that runs the business logic itself. A fixed sequence of steps decides which agent gets called and with what inputs, and what happens with the agent's output. That makes the run more reproducible. Execution generates a log of which workers ran, in what order, and with what inputs.
The same engine applies controls based on where each action sits against a defined threshold. Actions that clear the threshold execute automatically with logging. Actions in the middle route to a named human reviewer. Actions that miss the threshold escalate the request and permit no autonomous action. As agents make more decisions within each workflow, that deterministic layer becomes more important. Each missing control creates another point of exposure.
A human in the decision chain for high-stakes steps and a human watching alerts for high-volume, low-risk steps are different patterns. A defensible audit log identifies the reviewer and records the decision timestamp. It also captures the data shown during review. Without that information, the approval can't be defended.
Sanofi's Chief Digital Officer, Emmanuel Frenehard, set out to avoid exactly this cross-vendor problem. He told Fortune that he wanted to avoid connecting Salesforce and ServiceNow agents with agents from SAP. Each vendor-to-vendor handoff creates a potential span boundary; preserving one trace requires both systems to propagate the same trace context. It also creates another place where an unverified output can pass through. Sanofi built its AI workflows directly on its Snowflake data lake instead.
How Elementum Shrinks What Your AI Agent Observability Stack Has to Catch
The Annex III logging deadline moved to December 2027, but the inference cost curve is climbing regardless. AI agent observability tooling is available across observability and cloud platforms. Non-deterministic execution increases trace volume and evaluation work. It also raises incident-analysis costs because each run can follow a different path.
The fewer places an agent can improvise, the less your stack has to catch. The business case for observability also gets cheaper when the process engine creates the audit trail as it runs.
Elementum is the AI-native replacement for legacy SaaS. Control plane vendors monitor agents; we run the process. Our Workflow Engine determines the step sequence. Steps requiring reasoning call AI Agents, while automated logic handles the remaining steps. Exceptions and approvals route to the people who own them. AI Agents and automated logic operate as equals with people in one flow.
Configurable decision thresholds set where an agent acts, where a human reviewer steps in, and where nothing autonomous is permitted. You can adjust them without rebuilding the process. Every request logs which agent was invoked, which workflow ran, and the result produced.
This creates a complete system-generated record for one request that supports Article 12's logging and traceability requirements for high-risk AI systems. We build guardrails and input validation into every model interaction.
Our license is a flat annual fee per application, with no per-seat license, no per-conversation charge, and no per-action charge for AI. The AI line is therefore forecastable and doesn't scale with adoption.
Your processes run natively inside your own Snowflake tenant, with Databricks live as a second track and currently at MVP maturity. CloudLinks query data in place through encrypted connections, and the execution layer retains nothing after a run completes. Your data is always yours. We never train on, replicate, or warehouse your data.
Among enterprise AI platforms in this category, we have the production track record for replacing legacy SaaS at enterprise scale, with named customers including Sanofi, Snowflake, Under Armour, and Elevance Health.
Contact us to map governed AI workflows into your enterprise architecture and the rest of your AI roadmap.
FAQs About AI Agent Observability
What Is AI Agent Observability?
AI agent observability is the practice of capturing every step an AI agent takes, including model calls, tool invocations, retrievals, and control-flow decisions, as structured traces you can inspect and evaluate. It extends monitoring from single completions to multi-step, non-deterministic runs, where the failure usually hides in an intermediate step before the final answer.
How Does AI Agent Observability Differ From the LLM Observability You Use?
LLM observability records one model call: prompt, response, token counts, latency. Agent observability follows the whole run, including planning steps, tool calls, sub-agent handoffs, and the final output on a single trace. It also adds evaluation and governance signals such as task success and grounding.
Do You Need AI Agent Audit Trails Under the EU AI Act?
For high-risk systems, yes, though the compliance timeline moved. Article 12 requires automatic, system-generated logging over the lifetime of high-risk AI systems, and Article 26(6) obligates deployers to retain those logs for at least six months. The 2026 Digital Omnibus pushed the Annex III high-risk compliance date to December 2, 2027, but it didn't change what the logging has to capture once that date arrives.
Can You Use OpenTelemetry Alone for AI Agent Tracing?
OpenTelemetry GenAI semantic conventions give you a vendor-neutral schema for agent and model spans, as well as tool spans. Any compatible backend can read a trace that uses the convention. Every GenAI attribute remains at Development status rather than Stable, so expect attribute names to shift and keep the evaluation, guardrail, and audit layers as separate decisions.
Keep Reading
AI Agent Management: How Enterprises Govern Agents at Scale
AI Agent Observability and Monitoring: The Enterprise Stack

Agent Sprawl: How Enterprise CIOs Are Governing Hundreds of Disconnected AI Agents

What Is AI Agent Sprawl And How to Contain It
AI Agent vs AI Workflow: Orchestration vs Automation
AI Agents vs Chatbots: What Are the Key Differences?